Posts Tagged: performance

Why Does Data Center Location Matter?

Why does Data Center location matter?

Data Centers exist all over the world. They’re used to stored all sorts of computer data, including websites and web apps, like MIDAS.

The location of the data center that houses your cloud-hosted MIDAS system can have an impact on the quality of your overall experience.

One of the unavoidable aspects of long-distance internet communications is high latency.

What is latency and why is it important?

The term “latency” describes a measure of delay between two events. 

In the context of the internet, latency refers to the amount of time it takes for data to perform a round-trip between two points in a network. In the case of your MIDAS system, these two points are represented by your web browser and the server in a data center which runs your MIDAS system. 

The amount of time it takes for a unit of data to travel from the server in the data center to your browser is considered the latency of the network. This is usually measured in milliseconds and expressed as ms. This is also frequently referred to as the response time of a server.

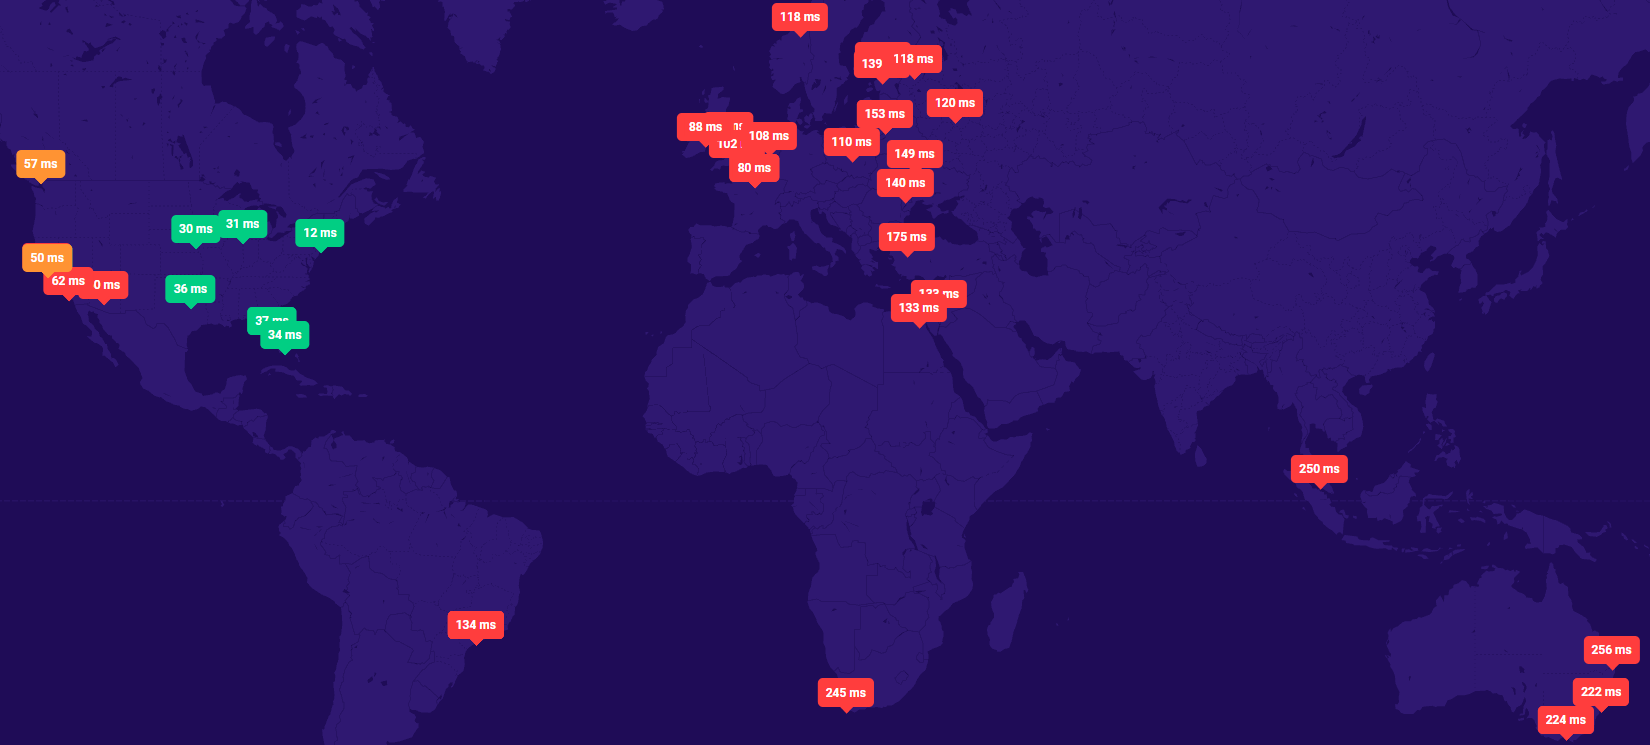
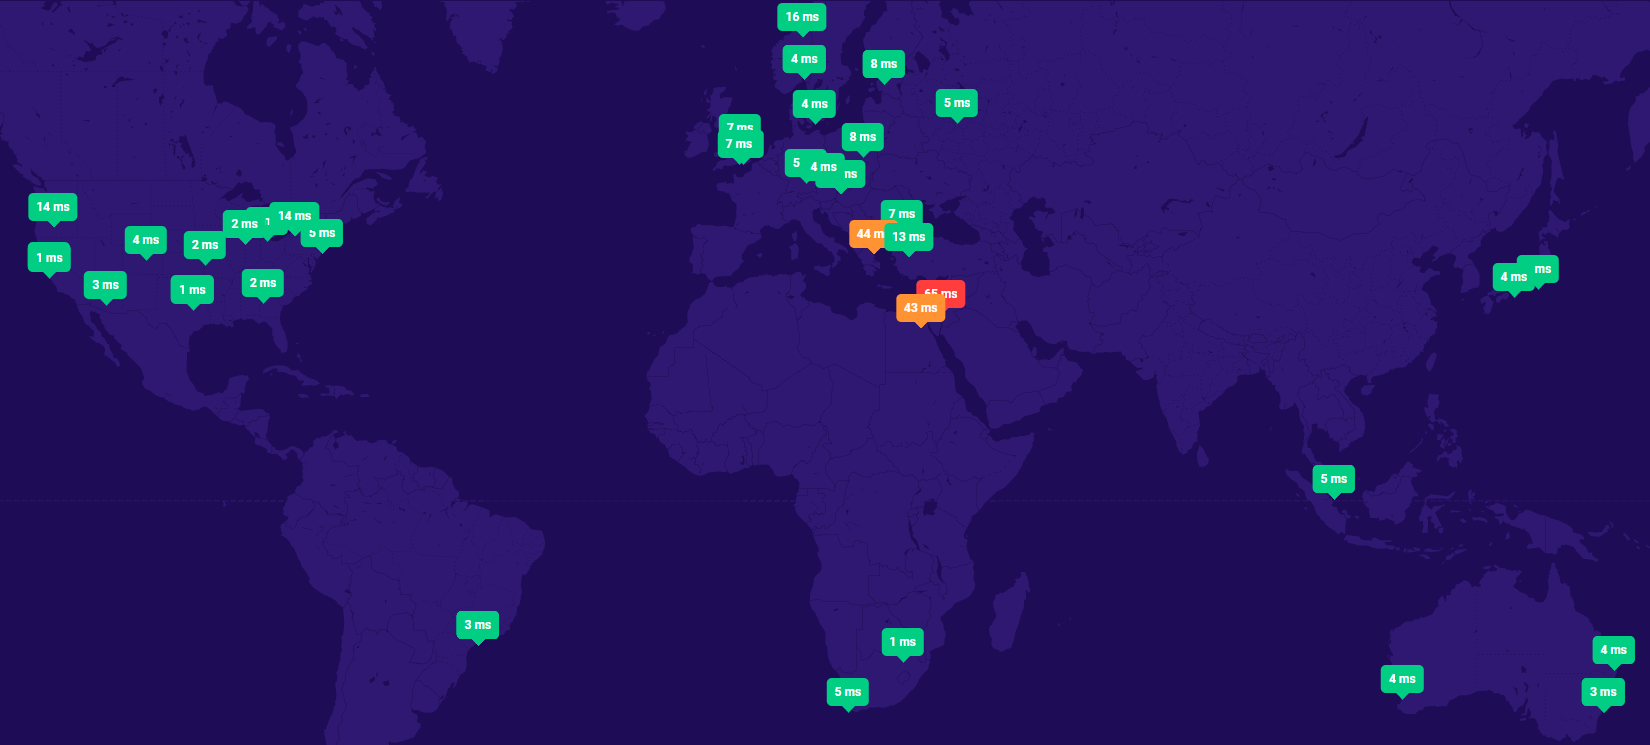
We recently added two new data centers to our network, including one in Europe.

In our testing, we saw lower latency leading to an approximately 30% improvement in page loading times for Europe-based users accessing a MIDAS system in our EU data center vs our East Coast US location.

How does a data center’s location help reduce latency?

Being geographically closer to a data center can have several benefits, including:

  • Lower Latency: When the distance between a user and a data center is shorter, the time required to transfer data is reduced. This results in lower latency and faster response times.
  • Improved Performance: Lower latency can result in improved performance for applications and services hosted at the data center, such as faster loading times for websites, smoother streaming, and reduced lag in online gaming.
  • Increased Reliability: By being geographically closer to a data center, users are less likely to experience network congestion, data loss, and other issues that can affect the reliability of their connections.
  • Better Compliance: Data centers located in specific regions may be subject to local laws and regulations, such as data privacy and security standards, which can affect their suitability for hosting certain types of data. By being closer to a data center, organizations can more easily ensure compliance with these regulations.

Our Data Centers

Earlier this year, we significantly expanded our network into new data centers.

We added new client nodes in a data center in Europe (in Amsterdam, Netherlands), and in a data center on the West Coast of the US (in Seattle, Washington).

These two new data center locations are in addition to our existing nodes residing in our East Coast US data center (in Atlanta, Georgia).

We then looked at the location of each organization with an active cloud-hosted MIDAS service. Those which were geographically closer to either our EU or West Coast US locations were seamlessly migrated to those data center locations.

Naturally, we provided customers with advance notice of proposed migrations, and allowed individual customers to opt-out, or to choose a different data center for their MIDAS system.

The client migrations went smoothly, and have lead to noticeable improvements through lower latency for many customers.

Because our cloud-hosted MIDAS systems can now be run out of three different geographic regions (US East, US West, and Europe), we now offer all new cloud-hosted customers a choice of data center where they’d like their MIDAS system to reside.


Every MIDAS booking system includes a “Recent Activity” log feature. This allows administrators to audit all activity taking place in their scheduling system.

The log records logins/outs, failed login attempts, bookings and clients added, modified, or removed, emails sent, database backups, and more.

The Recent Activity log can be quickly accessed by administrators from a dedicated toolbar icon.

Data from the log is shown on screen in chronological order (newest entries first), and is split into 4 columns:

  • Date / Time – The date and time that the event occurred
  • Originating IP – The IP address that the event originated from
  • User – The user account that initiated the event
  • Action – The event itself

The Recent Activity log may also be exported directly to Excel.

We’ve made a number of improvements to the performance of the Recent Activity log for MIDAS v4.28.

These include…

Log entries now load in blocks

Recent Activity Log entries are now loaded in blocks, with a "Show More" button show more entries
Log entries are now loaded in blocks, with a “Show More” button available to append the next entries

For each and every action which occurs in a MIDAS system, an entry is made in the recent activity log.

Entries in the log are typically kept for a period of 30 days before automatically being removed. This retention period can be change to keep logs for longer or shorter periods.

For very active MIDAS systems (or those with a long log retention period), the Recent Activity Log can become very large.

To display a lengthy log in its entirety could slow down the viewer’s browser, and in some extreme cases make it appear that their browser has frozen/hung.

To address this, from v4.28 the Recent Activity log no longer displays all its entries at once.

If the log contains a high number of entries, only the newest entries will be shown, along with a “Show More” button at the bottom of the screen. Clicking the “Show More” button will load and append the next set of log entries to entries currently shown on screen.

The “Show More” button will continue to show as long as there are more entries in the log which aren’t currently being shown on screen.

The number of log entries shown on screen is derived from the “Maximum search results to display per page” setting. This setting usually controls the number of search results returned per page via the built in “Search” feature. However, the number of Recent Log Entries shown in each “block” is twice this setting. So if “Maximum search results to display per page” is set to the default of “50”, then 100 Recent Activity log entries will be shown at once.

Failed login attempts are now collated

Failed login attempts are now collated into single entries
Failed login attempts are now collated into single entries on screen

One of the benefits of the Recent Activity Log is that it records all failed login attempts to your MIDAS system.

This may happen, for instance, if a user enters their password incorrectly.

Similarly, if may also happen if someone tries to login to a non-existent account.

In today’s world, hackers use automated tools to try to “brute force” their way into systems. They do this by sending automated login requests using different email/password combinations. Often dozens, if not hundreds, of automated requests could be made every second.

As MIDAS logs failed and invalid login attempts, automated tools could soon flood the Recent Activity log with failed login entries.

To combat this, we’ve made a change in v4.28. Now instead of displaying every single failed login attempt, multiple failed login attempts from the same IP address will show as a single entry. This entry will indicate the total number of failed attempts, the time of the first attempt, and the time of the most recent failed attempt.

Faster rendering and displaying of the log

In addition to loading log entries in blocks, for v4.28, we’ve also streamlined the actual HTML code used to display log entries on screen.

This has more than halved the number of “nodes” (elements) that your browser has to process and render in order to display the recent activity log.

The result is that the Recent Activity Log now loads far quicker than it did before!


We’re committed to regularly bringing exciting new and improved features to our easy-to-use room booking system, MIDAS. We also work hard behind the scenes to constantly improve the overall speed and performance of both our software and infrastructure.

In this article, we’ll take a closer look at some of the performance improvements we’ve introduced over the past year. We’ll also look at some of the performance improvements you can look forward to in the very near future!

Caching and CDN

CDN stands for “Content Delivery Network”. It is a means whereby web content – such as an image – is stored on multiple servers around the world. When the image is requested by a visitor’s web browser, rather than the image being served from a single origin server (which may reside in another country), it is instead served by the nearest/fastest server in the CDN network. The result is significantly improved loading times for content served via a CDN.

Back in May last year (2018) we introduced CDN support for static content for all our cloud-hosted MIDAS customers.

As a result, we quickly saw performance improvements and reduction in load times of customer’s hosted MIDAS systems by up to 67%! You can read more about this in this blog post.

Improved DNS

DNS stands for “Domain Name System”, and can be considered as a “phone book” for the internet. When you enter a website in your browser’s address bar, a DNS system is used to look up the corresponding server on the internet that the URL you’ve entered resolves to, allowing you to then access the site.

This week, we’ve migrated our DNS to a distributed/cloud-based system. Previously, our DNS was provided by our own web servers. So for example, if you wanted to access our blog (blog.mid.as) the DNS system would first have to make contact with mid.as to find out the location of blog.mid.as.

With our new distributed/cloud-based DNS system, DNS is now handled in a similar way to the CDN system outlined above. That is to say that when you enter a URL/sub-domain for any part of our site, the DNS is resolved on a server geographically close to you.

As a result, we’re seeing DNS lookup times for our site up to 5 times faster than previously!

The above images (from dnsperf.com) show how quickly the mid.as domain used to resolve from various locations around the world (left image) and again now (right image).

XML vs JSON

What and what?! XML stands for eXtensible Markup Language. JSON stands for JavaScript Object Notation. Both are methods for storing and transporting data, with JSON being the newer of these two methods.

As we’ve been developing MIDAS for well over a decade now, XML has been the format we’ve used for the main settings file within our software for the majority of that time. This is because JSON wasn’t really around a decade ago!. The downside of using XML – particularly when used in conjunction with Perl (the language which MIDAS is written in) – is that it tends to be a little slow and clunky.

That’s why starting with our next software update, v4.22, we’ll be dropping the main XML settings file in favor of a JSON settings file instead. In our own benchmark testing, this simple change has resulted in improved load times of ~10ms per request. This may not sound a lot, but is actually quite noticeable.

As a result of this upcoming improvement, self-hosted customers will need to ensure that the JSON Perl module is installed and available on their MIDAS system in order to be able to update to v4.22.

Instructions of how to do this may be found in our How to install Perl modules KB article. Cloud-hosted customers don’t need to worry about this, as we’ve taken care of it!